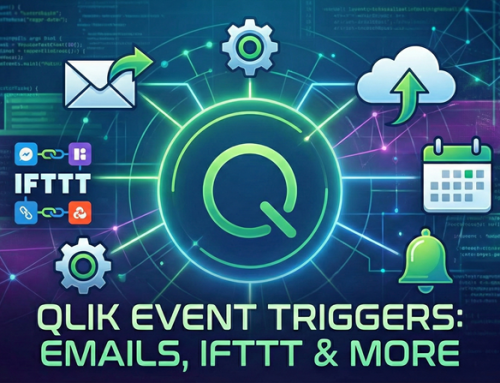
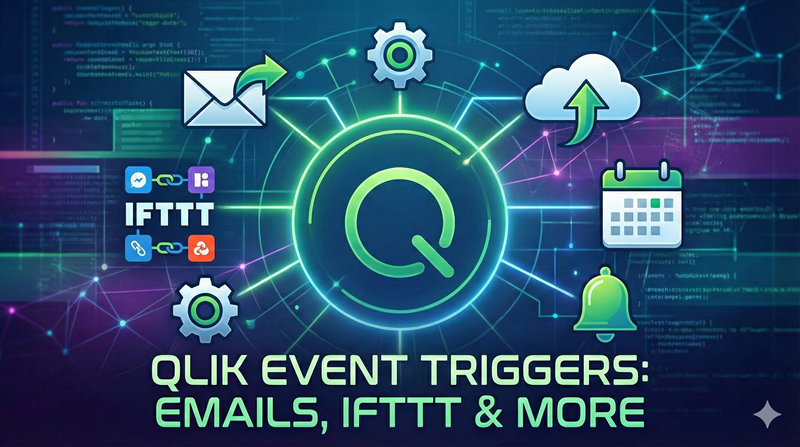
During the recent Qlik Luminary Meetup we were shown some really neat new features coming to the Qlik platform. Most of which I can not tell you about. However, I can tell you about two toggles already available in the product, These allow you to disable Sense Chart Suggestions and Insights for certain apps.
What Are These Features?
Before switching things off it’s probably a good idea to understand what it is that you are turning off. Both of these features are pretty neat and deserve some attention.

You will almost certainly have experienced Auto Chart, if you have ever dragged a field, dimension or measure onto a sheet. Sense will look at the object you have used and work out the best way to show those data. When you drag your first value it may show a KPI, if you drag a dimension field you may get a bar chart, add a second numeric field it may change to a scatter on two axis. All of this is done automatically, allowing lightning quick building of visualisations. It’s not always what you want though if you are building to a specification and you need to choose which visualisations are used where.The Insights Advisor is even more powerful, and seems to improve with each version of Sense. The button for this can be found at the top right of the page. Once in you can type a question and Sense will create some charts which it’s AI algorithms feel will answer that question. You can finesse the answers you get, by directing the advisor which fields are measures and which are possible dimensions. A user with no chart-building skills can be shown a number of auto-generated charts and then pick which ones they want to use to build out their dashboard. Again, it’s not always what you want in every situation.
So, How Do I Turn Off Insights and Auto Chart?

Thanks Matthieu Burel for taking the photo.
SET DISABLE_AUTO_CHART=1;

SET DISABLE_INSIGHTS=1;
Or, alternatively you can click the Variable button whilst in edit mode and create them there. You will need to refresh your browser after setting the variables if you are going that route.
From my testing (in Qlik Sense Business) it appears that it does not matter what the variable is set to, as long as it exists. For instance, if you want to enable the feature for some users but not for others you are out of luck. Counter intuitively, if you set the values to zero they are still applied.
In order to remove these settings you need to delete the variables from the Variable Editor (and again refresh) or, if you created them in script, you will need to set them to null (by changing your script to SET DISABLE_AUTO_CHART=;) and do a reload.

A word of warning regarding the use of DISABLE_AUTO_CHART though. If you have objects in your app that were created using Auto Chart and have not had the toggle turned off these will break and you will be shown an error message. When this happens you can not simply then change it to not be an auto chart, you have to remove the variable again, change the properties and then re-apply the settings. Remember also that whilst you may have changed all of your auto created charts, self-service users may have some you are not aware of. This is perhaps an option to only use on brand new apps. The same issue does not seem to affect charts created with the Insights Advisor when that is turned off.Go On, Tell Me About The Other Cool Stuff
Where at previous events we have been shown things which have been a little frivolous and not of much use to a Qlik consultant like myself (two such features referenced above) there was a lot more to be optimistic about this time. I think it is safe to say that the recent acquisition of Attunity is going to result in improvements to the Qlik platform across the board, rather than this just being a separate product that Qlik sell. It’s also clear that the Cloud/SaaS strategy is core to Qlik’s future direction and not just something on the periphery, this could bring some exciting benefits to users.
The new features I am happiest to see though may be with us either by the end of this year or early next. Both are bridging the feature gap between QlikView and Sense, and are a simple checkbox and drop-down that can presently be found in QlikView chart properties but are not yet in the public release of Sense. Watch this space.
Massive Thanks Go To…
Whilst this post may not be the ideal place for it, it would be impossible to write a post that mentioned the Luminary Meetup without giving thanks to Viktoria Lindback. She has headed up the Luminary programme for Qlik since it’s inception and has grown the Luminary Meetup from ten people just four years ago to forty Qlik enthusiasts this past week. It was a fantastic event and it’s very existence is largely thanks to Viktoria’s hard work. She is now leaving Qlik to study for an MBA, and I’m sure every Luminary wishes her well and is grateful for what she has done for us. Thank you.


Have you tried adding;
{
“flag”: “DISABLE_AUTO_CHART”,
“enabled”: true
}
To capabilities.json under C:/ProgramData/Qlik/Sense/CapabilityService/?
Found this in an older (feb19) help for BDI – https://help.qlik.com/en-US/associative-big-data-index/February2019/Content/QABDI/qlik-associative-big-data-index.htm
Hi Johan,
Thanks for sharing that, it’s not something I have tried. I presume this turns off Auto Chart for the whole server. It’s interesting looking at each iteration of the BDI documentation, it goes from that change to the Capabilities.json, to referencing the variables above to not mentioning turning it off at all (just saying it doesn’t work with BDI). I would have thought, for the purposes of making BDI work, turning it off at an application level would be best. For the purposes of always being able to create a filter pane by dragging a field the capabilities change sounds good.
Given that it may be worth trying the same with DISABLE_INSIGHTS.
Thanks again,
Steve
[…] PS: Svoje sumáre z Luminary Meetupu už spísali viacerí účastníci, môžete si ich prečítať napríklad tu alebo tu. […]