This week saw the 10th Qlik Dev Group in London. It was notable not only for the first non-Qlik based presentation, from the wonderful Nadieh Bremer, but also the first public appearance of VizLib. In my opinion, what VizLib are bringing to market is about to bring about a major shift in Qlik Sense use, and it all starts now.
First Signs of Life

The first signs that something was about to happen (or at least the first I noticed) was when Martin Mahler updated his LinkedIn employment title to CEO of VizLib. I dropped Martin a note, but he didn’t offer too much in way of explanation, and the website at VizLib.com simply had a “coming soon” placeholder. Things then started emerging, first on Twitter and then on their own website. One by one, three freely available extensions were released for Qlik Sense under the VizLib banner, I will look at each of these in a bit.
As the information for the Qlik Dev Group was made available as were the details of who VizLib were in their entirety. Martin had teamed up with David Alcebero and Adam Cooke, names I was familiar from Qlik Community and from Qlik themselves. Things were certainly starting to look very interesting.
The Extensions

The first extension that I saw from the VizLib stable was the TimeLine. This really is a demonstration of the art of the possible in Qlik Sense. With data loaded in giving details of starts, duration and media related to events a truly dynamic presentation of a timeline can be shown within Sense itself. Whilst I can’t see a use case where I will be embedding this into any of my clients’ analytics apps any time soon, it showcases the use of Sense as a portal for data presentation of any kind.Full details and download here: https://www.vizlib.com/storytimeline/.
From here I then discovered the Advanced Text Object, and this is when I truly started to get excited. This one component delivers on everything that the QlikView text box does, with a few extras thrown in. All of the frustrations within Qlik Sense are removed, and my recently published blog post was rendered obsolete in an instant.

Colours based on functions, different fonts, borders and a large number of actions (looking suspiciously like the QlikView list of actions) are all present and correct. Something that is missing on native Sense objects is the dynamic show/hide, not so with VizLib objects that’s here also. The tool-tip functionality (to show a custom text box on mouse-over of a text object) adds even more possibilities. The huge number of properties that can be set in the accordion give a developer whatever they could possibly need.
Full details and download here: https://www.vizlib.com/advancedtextobject/
Finally, on the day of the Dev Group itself I spotted the final extension that is available as at now, the VizLib scatter chart. One of the frustrations that I have with Qlik Sense is that functionality that I have grown to use frequently in QlikView is simply not there out of the box in Sense. Donald Farmer said at an early Dev Group (No. 3?) that the intention was that the API would be opened up so that anyone could create visualisations, and that has certainly happened. This doesn’t mean you can find anything you want though, and I took to Qlik Community to find how to replicate a chart I used in QlikView showing points transitioning from prior period to now (https://community.qlik.com/thread/208446), with no luck.The VizLib Scatter chart takes that requirement and knocks it out of the park, delivering on the animated time charts of the late, great, Hans Rosling in the process.
Full details and download here: https://www.vizlib.com/scatterchart/
I’ve not put masses of detail and screenshots here, please go to the VizLib site to find out just what you can do with these extensions.
The London Dev Group
VizLib were the sponsors for the 10th London Qlik Dev Group (thanks for the pizza guys!), and therefore got to set their stall out at the start of the evening. There was a definite sense of appreciation as they outlined their core values (easy to use, highly customisable and supported) and demonstrated some of their wares. The “customisable” I have already touched on above, with the accordion options, but it is the “supported” that I think is crucial here. There are already many extensions out there, offering various bits of functionality, but it is a risk to use any of them – what happens when Sense is updated, will that extension you downloaded still work? Businesses need to know the business critical apps they create are supported at all levels.
Obviously that support is going to come at a cost, and whilst no details are available at this time, it appears that this is going to be done on a subscription based model to the entire suite of VizLib visualisations. This suite is going to be one that is expanded in time, and already teasers are up on Twitter.

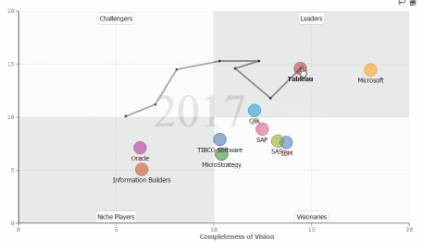
It will be interesting to see what price point access to these additional extensions will come at. From my experience though, it is much easier to get sign off for a larger spend than a smaller one in some enterprises. This is something I have seen Easy Qlik QViewer be a victim of, with users simply not being able to get a spend that small through purchasing, so end up buying a personal copy to use at work. This is something I hope that VizLib pitch just right, not just because I wish Martin, David and Adam all the best with this venture, but also because I want to see the Qlik platform continue to grow and outshine other BI Leaders. It is only with the realisation of the vision of the open API that the platform can truly reach it’s potential.
Also of note in the presentation was the mention of two heavyweight collaborators with VizLib, in the form of Websy and Ralf Becher, both of whom already have some excellent extensions on Branch. This willingness to collaborate and innovate will surely also serve VizLib well.
Later on in the evening it was Qlik’s turn to enlighten the group on where they are seeing things going with their product set. The good news is that with the platform and foundations firmly in place there are going to be improvements that will allow Qlik, to create new visualisations and integrate them into the product quicker. This means that we should be seeing more visualisation functionality in the core product soon. Whilst on one hand it looks like they are now going to be playing catch up with other providers, I think that having a well featured base product is crucial to Sense’s continued success. When we introduce Sense to prospective new clients, saying we can make it do what they want only if they bolt on a bit extra off of the Internet is not that strong a sales message. Third party extensions should be there for the people who want to take things to another level, not just those who want to emulate what they can do in QlikView. Hopefully VizLib and others can blaze the trail, and show Qlik what they should be baking into Sense out of the box (trend line through a bar chart, anyone?).
After the room cleared out, it was time for me to continue to do research for this blog post, over a couple of cold ones at the Flight Club on the City Road. Among those who joined us, including all three VizLib founders, there was a real sense that things are really going to take off from here.
I for one am looking forward to seeing it unfold.


Thanks for the update Steve… I wish I could have made it to the Dev Group session!
I was very upset though to read your mention that Hans Rosling has passed on! I hadn’t heard that sad news :(
Hi Richard – You may be getting a Dev Group nearer to you, can’t remember if that was “announced” or whether it was from me chatting to Matt, so I don’t know how cast in stone it is. Sad news indeed about Hans Rosling, I always show people his videos when I try to explain to them why I get excited about data-viz.
Very interesting stuff, hope to see a price not to high and the possibility to use them without internet connection. A lot of my clients does not have internet access from their sense servers
Hi Johan – I can’t imagine that internet connectivity would be a pre-requisite, unless they use a check back to the internet for validating licencing when the subscriptions launch. Hopefully one of the VizLib guys can comment?
Hi Johan,
We are very happy to hear you are finding it very interesting.
Vizlib will be offered both on the cloud (internet connection required) and on premise (offline mode). More information will be made available closer to the launch of the library.
In fact one of our customers is already using Vizlib successfully in a highly regulated environment (pharma industry) where connections to the internet are prohibited.
If you have more questions, feel free to give me a shout (eMail below).
Regards,
Martin
Vizlib CEO
Martin.Mahler@vizlib.com
Hi Martin
Big thanks for taking the time to answer questions on a blog post, highly appreciated.
I was referring to the following statement in vizlibs terms and conditions (https://www.vizlib.com/termsandconditions/);
“Data visualizations
Vizlib is a Software as a Service platform and as a consequence, a live Internet connection is a pre-requisite for data visualisation.”
Hi Johan,
Thank you very much for your reply.
The aforementioned Vizlib Terms & Conditions apply to the extensions that are currently available to download for free on our website. They do not constitute part of our planned service offering, which will be released in the near future and will cover both a cloud as well as an on-premise version.
Thanks,
Martin
[…] Introducing VizLib […]