One of the most powerful features of the Qlik expression language is Set Analysis. This syntax allows you to build visualisations to compare sets, most notably delivering prior period comparisons. This blog post pulls together some previous posts and examples which use Set Analysis.
Set Analysis Background
Just to give a bit of context to these posts; Set Analysis is a subset of Qlik expression language. It always appears within an aggregation and causes that aggregation to only work over part of the data. For example, the following will sum the number of tests carried out on Ford vehicles:

sum({<Make={'Ford'}>}TestCount)The Set Analysis part of the statement is the part encapsulated in squiggly brackets, which is making the selection. Here we are selecting a single make of vehicle, with an exact match on our criteria. The syntax allows all kinds of different criteria to be provided across multiple fields and with both string and numeric partial matches.
The following shows how a Set Analysis statement can grow to combine multiple sets for comparative analysis:
sum({<Make*={'Ford'},Class*={">=5"}>+
<Make*={'Honda'},Colour*={'Green'}>}TestCount)
Here, all tests are counted for Fords of Class 5 or above, and for Hondas but only if they are green. If this was used in a table or chart with Make as a dimension then two completely different subsets of data could be compared. This is perhaps not the most practical example of Set Analysis, but hopefully it gives an indication of what the syntax can achieve.
The following posts and apps all assume a bit of knowledge of Set Analysis, but hopefully you will be able to follow what they are doing. The full syntax of Set Analysis has been discussed online many times previously, so a quick Google should answer any questions you have.
Prior Period Comparison

One of the most common use cases for Set Analysis is the comparison of prior periods to a recent one. The following apps, with Sense and QlikView versions of the same code, show how various periods can be derived using Set Analysis so that the difference and variance to these periods can be shown. Both include a table that can be copied and pasted into your own app and, if you have similar date fields in your data model, they will work with minimal changes.The periods included in the apps are; Year-To-Date, Prior Year-To-Date, Month-To-Date, Prior Month-To-Date and Month-To-Date in Prior Year.
By looking at the Set Analysis code for these, further periods can be derived for your own purposes, such as Last Complete Month or Quarter-To-Date.
To download and try these apps yourself use these links:
Qlik Sense App: Prior Period Comparison
QlikView App: Prior Period Comparison
Calculating a Run Rate
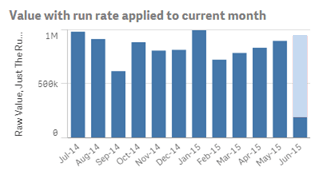
Once you have derived the values for various periods within your data, as per the above examples, you can then do further calculations on them. One way that this can be used to good effect is in calculating a run rate. This is where you calculate the expected value for the end of a period that you are in the middle of, by looking at the value to date and applying a factor.
I published a LinkedIn Pulse article that discusses the technique in more details, including various ways of visualising your run rate. You can see that post here:
LinkedIn Pulse: How To Improve Your Run Rate
In producing that article I wanted to show a selection of charts demonstrating the technique. Naturally, I turned to Sense and QlikView to produce these images, which in turn lead to a tutorial blog post and two more example apps on Qlik Community.The blog post can be found at the following link and the examples are linked from within that post:
Qlik Tutorial: Calculating A Run Rate
Star Equals In Set Analysis
A Set Analysis statement is made up of Set Identifier, Set Modifiers, Assignment Operators and Set Operators. The Set Modifiers are the part that describes how the set should be applied to the associated field. When looking for a match to a set I often see the equals set modifier used. This applies the set, but ignores all other selections on the field. To my mind this then produces counter-intuitive analysis for the user.

I blogged on the usage of star-equals as the set modifier. This matches the set to the field, but only when the values in the set are in the current selection (the intersection). In my opinion this should be your go-to set modifier for Set Analysis expressions.The blog post demonstrates why this is the case, and again has a link to a downloadable example. You can find it here:
Qlik Set Analysis Tutorial: Star Equals
Further Examples
These are the examples that we have shared which are most relevant to learning and getting the most out of Set Analysis. We have shared numerous other example apps, which we have listed on this page:
Qlik Sense and QlikView Examples
I’m always happy to hear from our readers, so please feel free to post questions in the comments below, or on the individual posts or Qlik Community pages.


Leave A Comment