One of the neat features in Qlik View that has not found it’s way into Qlik Sense is the Cycle Group. Alternative Dimensions are nice, but only affect one visualisation at a time. Here is how you can create a cross-visualisation cycle.
The Challenge
As Sense has matured more and more of the gaps between it and the features we were spoiled with in QlikView have come across into Qlik Sense (this is even more true if you turn to extensions, both free and fully supported). There are still some annoying omissions with Sense “out-of-the-box” though, especially if you are using Qlik Sense in the Cloud – where extensions are not yet supported.
One thing that I made a lot of use of in QlikView was the Cycle Group. This is very useful for allowing users to self-serve their analysis, by picking which fields to view measures over. What was particularly useful with the Cycle Group is changing it on one chart then changed it in all others simultaneously – so you could view multiple measures over one dimension in different charts. The toggle button technique I blogged on previously could be used for this, but has the drawback that it is not so easily extendable and requires an extension (so Qlik Sense Cloud is out).
Fortunately, there is a solution which I have been using for some time – and I will share it with you now.
The Data and The App
As we are currently in the closing stages of Wimbledon (it may be all over by the time I hit Publish) I thought I would find some tennis related data. As is often the case; Wikipedia came through on that front, with this table of Mens Singles Grand Slam Finals.
https://en.wikipedia.org/wiki/List_of_Grand_Slam_singles_finals
As with many of my other examples the example related to this tutorial can be downloaded from Qlik Community here: https://community.qlik.com/t5/Member-Articles/Create-a-Cycle-Group-in-Qlik-Sense-without-extensions/ta-p/1480800
As ever, likes shares and comments are always welcome on these apps if you find them helpful.
Building The Cycle
This solution will work over any data set, but just as with QlikView Cycles you do need to ensure that every dimension value you add works with every measure you run over it.
If you want to follow the example I have here you will need to connect to and load the Wikipedia Grand Slam data I reference above. Create a new Web connection, called GrandSlam in sense and paste in the URL.

The script to load the data is then this:
GrandSlam:
LOAD
    1 as Count,
    1 as Won,
    0 as Lost,
    "Year",
    Tournament,
    Replace(Replace(
    	SubField(Tournament, ' ', 1),
        '.', ''), 'as', '') as [Tournament All Era],
    if(index(Tournament, 'Open') > 0
    	or Tournament = 'Wimbledon', 'Open', 'Pre-Open') as Era,
    'Won' as Result,
    Winner as Player,
    Winner,
    null() as [Runner-up]
FROM [lib://GrandSlam]
(html, utf8, embedded labels, table is @2);

CONCATENATE(GrandSlam)
LOAD
    1 as Count,
    0 as Won,
    1 as Lost,
    "Year",
    Tournament,
    Replace(Replace(
    	SubField(Tournament, ' ', 1),
        '.', ''), 'as', '') as [Tournament All Era],
    if(index(Tournament, 'Open') > 0
    	or Tournament = 'Wimbledon', 'Open', 'Pre-Open') as Era,
    'Lost' as Result,
    [Runner-up] as Player,
    null() as Winner,
    [Runner-up]
FROM [lib://GrandSlam]
(html, utf8, embedded labels, table is @2);
As I mentioned though, you can use this technique with any data set that you have.
The first thing you need to do is build a table, in your load script, which contains all the cycle dimension fields. This table is to have a dimension and a sort order, and can be built using an inline load; like this:
Dims:
LOAD
    Dim,
    RowNo() as DimSort
INLINE [
Dim
Player
Tournament
Tournament All Era
Era
Year
Winner
Runner-up
Result
];
If you are not familiar with INLINE loads, they are a way of typing data straight into your load script. The field name and all values are typed straight in (or copied and pasted from a previous LOAD statement). The sort order is created on the fly, based on the order of the values in the INLINE section. If you have lots of fields to pick from, or you want to delegate management of the cycle list, this can come from a spreadsheet or database instead.
Save your load script and perform a reload.
![]()
Now, go into the App Overview, and then on into the sheet you wish to place your cycle group on to. Click the Edit button, so we can do this. Here we are going to drag a the Dim field onto the page, click the Fields button and drag dim into space. You will probably need to resize it to be smaller.

Now we want to change the legend on the Filter, by setting the Title (under Select Dimension Field in the right hand accordion) to:
=if(GetPossibleCount(Dim) = 1, 'Dimension: ' & Only(Dim), 'Select Dimension Field')
This will show the dimension name, if there is one selected, or prompt the user to select a dimension if they have not yet done so. We will use the dimension we have given most precedence with the sort if there is more than one possible value – this is explained soon.We also want to ensure that the values in the drop down appear in the same order as we had them in our load script. This is why we added the Dim Sort field, and that needs to be entered in as an ascending sort order, with this code:
=min(DimSort)The filter should look like this:
![]()
We now want to create a couple of variables. Whilst in Edit mode look for the variable symbol at the bottom left of the page, hopefully the creation of the two variables will be intuitive from there:
![]()
The first variable is to find the lowest possible sort number associated with a dimension, and the other is to return the dimension name itself.
vMinDimSort:
=min(DimSort)vDim:
=minstring({<DimSort={$(vMinDimSort)}>}Dim)You will note that the first variable is nested in the second variable, and is used to pick out the dimension we have given precedence to with the sort order, rather than the first dimension alphabetically.
Now that the variables are created, we can use them in our first chart. To do this drag a table object onto your sheet:

Once the table is on the sheet you will want to add your dimension to it. This includes a reference to the second variable we constructed and should read like this:
=[$(vDim)]The dimension name, sadly, can not be derived from an expression (why, Qlik, why?) so we have to put a generic label in here, I’ve gone for Dimension [Note this is no longer the case, you can create a Dimension label of =’$(=vDim)’]. I’ve heard a rumour that dynamic label and expression labels will arrive at some point soon – I hope this is the case as they are essential for decent point-in-time reporting. Anyway, the dimension settings should look like this:

For the Grand Slam Tennis example you will also want to tick to remove nulls from this dimension (using the tick box) due to how each match is split onto two rows with null values in the Winner and Runner-up columns. Also, it is a good idea to set the alignment explicitly, so you don’t get years aligned to the right and other dimensions to the left.
You now need to enter in the expressions that you want to run over your dynamic dimension. You can create each of these as Master Items and then simply drag them onto the table. Master items are under the chain link item on the left. Select this, then measures, then Create New, like so:

The master item for matches played should look like this:

The master measures I have created are:
Played
Count(DISTINCT Tournament & Year)

Won
Sum(Won)

Lost
Sum(Lost)

% Won
Sum(Won) / Sum(Count)

% Lost
Sum(Lost) / Sum(Count)
Once all Master Items are created you can drag them onto your table and configure them.
We can even set up our dimension as a Master Item (under Master Items, Dimensions) so we can simply drag that onto further charts:

Once all of the measures have been dragged onto the table, the numeric types have been sorted (you should be fine with the counts, but the percentages will need setting under the Measure settings) you should have a table like this:
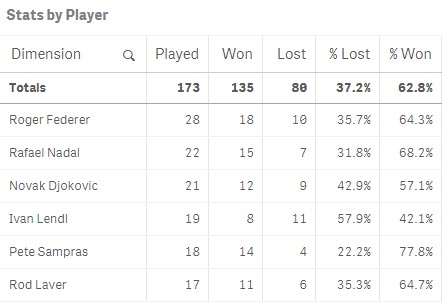
Using the Filter Box we added earlier on we can change the view so that it shows the values by different dimensions.
I’ve then extended my app to have charts for four of the measures, and the beauty of this solution is that when the dimension changes for one object it changes for all of them:

If you are following this example then hopefully you will be able to create something similar, or you can just download my finished app from here.
Conclusions
Hopefully that has given you everything you need to create your own cycle filter groups in Qlik Sense, against your own data. The technique can also be employed in QlikView, but generally I would use the native Cycle Group as that works well. Having the fields listed in a List Box can be more intuitive if you have users that you are not looking at training.
An extension of this technique that I also use extensively, particularly in QlikView, is to load a list of expressions from a spreadsheet into an app and then provide a List Box to select the expression. This way you can have multiple charts on a page, with different dimensions, all of which can show the same expression that the user has selected – kind of the opposite of the example above. This can be further expanded to allow selection of multiple expressions, perhaps to do ratios or a scatter chart. It’s slightly more involved to get expressions working rather than dimensions – perhaps that is one for a future blog post!
Thanks for reading. As ever please feel free to comment, share etc.


Hi Steve, Thanks for the post. I used it to add a dynamic dimension to a table and I ran into something curious. Instead of defining the sort in the properties, I created a dual data type so that it would be sorted automatically. The funny thing I learned is that the MinString() function applied to a dual data type returns the text that has the smallest numeric value. I assumed that it would have returned the “first text value in the text sort order” as per Qlik help. In that case, I didn’t need to use any set analysis to always show the first sorted value.
Also, good to know that the HidePrefix variable still works. I hate to have these types of selections appear in the selections context.
Best, Karl
Hi Karl – thanks for pointing this out, as you say it makes the implementation slightly simpler. The what that works is different to how it did in QlikView, but I suspect that this has now changed also. I would be slightly nervous about the functionality of minstring changing in future – to match the documentation – but nine times out of ten you would want the lowest numerical value represented as the string. I quite like the fact that you can alter the selection from the selections bar, and track what you are looking at, in this instance. Knowing that HidePrefix still works in other contexts is good though.
Nice article, Steve !
I would add to all you’ve said the idea to define the expressions as
num(YourExisting Expression,’#,##0 %’)
(at least for the expressions with percentages).
In order to do this, with inline command, another separator different from comma should be used (for instance semicolon) in the inline statement.
Nice tip, thanks for sharing. I have used a replace statement in the past and swapped out a little used character (usually ¬) for char(39).
Nice Article Steve. Thanks.!
[…] dig into the details by displaying several metrics based on a cyclic dimension (thanks for the idea Steve). Interestingly enough, this tab was built using only extensions. No native objects at […]
Hi Steve,
thanks for the post.
I used a similar technique in QV because this is a failry easy to manage solution and it is more intuitive for the end user compared to the actual cyclic group.
On the other hand I found some strange behaviour in Qlik Sense. In particular QS seems to have some issues in managing squared parenthesis [] that wrap the field name: when using parenthesis in fact, the chart gets calculated correctly as expected, but QS has problems assigning colors. When the name of field is wrapped in squared parenthesis the only colour used in the chart is grey. Of course you don’t need to wrap the field if its name has a single word, but I found no way to apply this technique for fields with spaces in their name.
Did you experience the same? Have you found a solution to this issue other than replacin spaces with other characters in field names?
Thanks
Ciao
Paolo
Hi Paolo,
Thanks for your comment. I’ve seen a few cases where Sense renders bars in grey (usually when using Set Analysis in the expression) but I’ve not seen it in this scenario. In fact, I’ve just tried to cause the issue you describe and can not get it to occur. Which version of Sense are you using? Did it happen with the example file that comes with this blog post?
Thank you for sharing.
I am attempting to apply similar idea but with expressions. The expression calculation should be in the data island which affords me the opportunity to delegate maintenance responsibility.
I have searched for a Sense example without success.
Thanking you in anticipation for a Sense example
Hi Gavin, thanks for the comment. This is something I have done many times in QlikView, but don’t yet have a Sense example I can share. As you say, the way to apply this will be very similar as to the example I have shared about picking the dimension. You will want three columns in your table, %Expression, %Legend and %ExpSort. As you will be picking the legend in the filter pane, but using the expression in the expression (suggest using a Master Measure) you need to use a little set analysis. The measure will need something like =$(=maxstring({<%ExpSort={'$(=min(%ExpSort))'}>%Expression)) and you will want similar for the legend =maxstring({<%ExpSort={'$(=min(%ExpSort))'}>%Legend). There may be some hurdles with reserved characters in the expression (such as $ sign, comma and single quotes) but if you use a spreadsheet rather than an inline table to contain the expressions you should be okay. Hope this works out for you.
Hi Steve,
Can we build cyclic measures as well this way ?
Regards
Sushant
Hi Sushant, Yes – the approach is very similar. You just need to watch out for single quotes and variables in your expressions, as these can be problematic to load into a field or pull from the table.
Hi Steve,
I think for cyclic measure, it will be even more easier. We might not even require variables as used in Cyclic Dimension.
I just created an inline table with field KPI and KPIsort.
Dynamic Measure = IF(KPI=’Won’,Sum(Won),IF(KPI=’Lost’,Sum(Lost),IF(KPI=’Count’,Sum(Count),0)))
Do you see any benefits of creating variables in case of Dynamic Measure?
Regards
Sushant
Hi Sushant, in that case you can simplify the expression by doing the following alt(sum($(=minstring(KPI)), 0). You could put the entire expression into the inline table and then just do =$(=minstring(KPI)). Good luck!
Cannot get this to work in Sense. I coded identically to the above, step by step, except that my column name is DimName instead of Dim
Finally, I coded $(vDim) as this:
minstring({} DimName)
It displays correctly in a text box, but the use of =[$v(Dim)] gives an error when used as a calculated dimension in a .chart.
Dave
Hi David, in your example you have the v on the wrong side of the brackets, but I guess that isn’t the case in your app? In the variable for vDim you need to have an equal sign in front of the minstring, to get the value outside of the object it is used in. This technique is used extensively in our Instant Sense Application, suggest you download and take a look at how that works and you should be able to figure it out: https://www.quickintelligence.co.uk/isa/
In my last post when I click “Post Comment”, it stripped out a bunch of the minstring() code, so you cannot see it. So I will just enter as a forum post.
Thanks
Hey Steve,
I packed the CycleDim into a filter window. When selected, the selection is locked in the menu bar.
Any option by a button to remove the locked value under “actions” does not result in me getting the locked out of CycleDIM either to the Min(DimSort) or unlocked. Like a filter, which can then be removed via “clear all Selections”. I hope I have made myself understood. It would be great if I could get support.
Hi Peggy,
There is an option where you can lock a selection, so you can manipulate other selections whilst leaving that one in place. It sounds like you may have inadvertently turned this option on. Click on the field on the Selections bar and you will note a padlock. Check that this padlock is open, and click it again if not. If it is not this Sense may have just got confused somewhere – if this happens then try refreshing the browser this can sometimes unblock things. Good luck!